Appendix B — The Top 2000 & The Evergreen Top 1000
C A comparative analysis of Dutch music charts
Leiden University, minor Digital Humanities and Artificial Intelligence, course Information Visualization and the Humanities
Dr. Y.C. Ryan
January 14, 2024
1. Introduction
‘Dutch people are very font of lists’, Jurre Bosman, director of Audio NPO, claims in an article of the NOS (2023). To support this claim he mentions the oliebollentest and the list of best selling cars. The NOS article is about the popularity of music charts in the Netherlands. Almost every radio station has its own chart. The most famous one is the NPO Radio 2 Top 2000 chart. It’s often called de lijst der lijsten, the chart of charts. The focus of this chart is the best songs of all time. Another Dutch chart is the NPO Radio 5 Evergreen Top 1000 . This one focuses on evergreens. These are songs that remain popular over time. Both charts are compiled by the listener. In this project the two charts will be compared and contrasted. The research question that will be answered is: What are the differences and similarities in content between the NPO Radio 2 Top 2000 chart and the NPO Radio 5 Evergreen Top 1000 chart? This question will be answered by analyzing the charts of 2023 in RStudio. The methods will be further discussed in the next paragraph. After that, the results will be given. Finally, the discussion will follow.
2. Methods
The data used in this project exists of the NPO Radio 2 Top 2000 chart and the NPO Radio 5 Evergreen Top 1000 chart, both from the years 2022 and 2023. The charts have been downloaded from the websites of NPO Radio 2 and NPO Radio 5 respectively. Data about audio features is obtained by exporting the playlists Evergreen Top 1000 (NPO Radio 5 2023) created by Hitnoteringen and NPO Radio 2 Top 2000 (2023) created by NPO Radio 2. To do this, I have used Exportify.net. To be analysed, the different sets had to be joined together. For this, they had to be cleaned. I have manually checked the format of the song titles in the data. So that there would be as little differences in capital letters and punctuation as possible. Also, some songs had the same title. These had to be given some specification. Furthermore, some songs in the charts were not in the Spotify playlists. As a result, their audio features are missing in the data. To be more precise, four songs of the Top 2000 are missing and six of the Evergreen Top 1000. These are just small number. So, I have ignored it for this project. The data set is not perfect, but quiet complete.
In this project only the first thousand songs of the Top 2000 have been included in the analysis. The Top 2000 contains twice as much songs as the Evergreen Top 1000. Research has shown that the first 1500 songs of the Top 2000 have a different distribution than the songs lower in the chart, which may be caused by two different types of voting strategies. The top ranks are probably the result of voting with taking into account the assumed preferences of other voters, while the lower ranks are probably the result of voting on personal preferences (Prinz, 2017). Besides, the Evergreen Top 1000 chart only consists of thousand songs. Therefore, in this project only the first thousand songs of the Top 2000 will be analysed. The rest of the songs will be ignored.
3. Results
Comparing years of publication
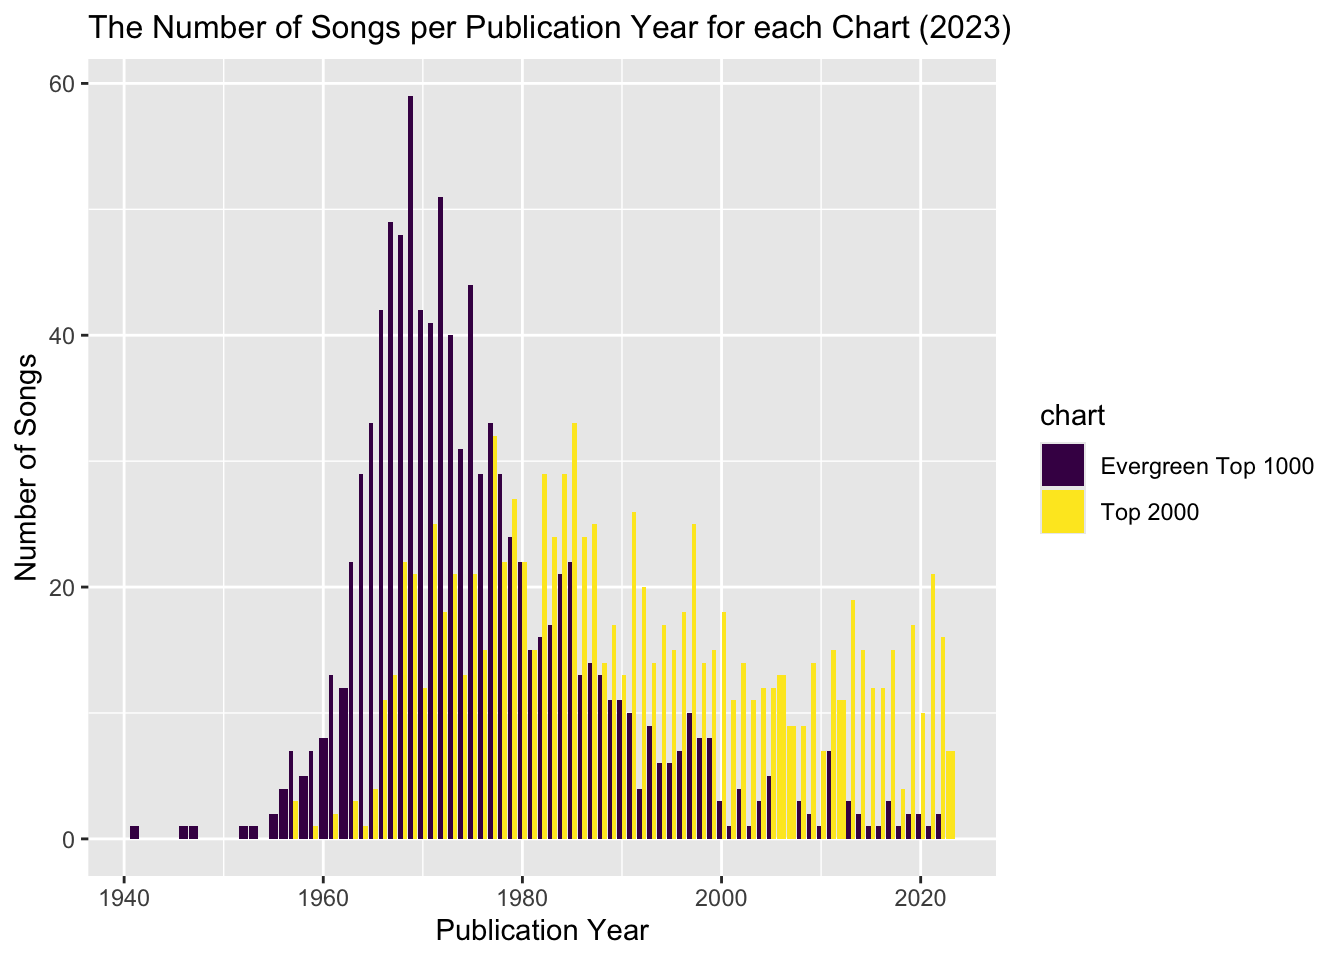
As can be seen in visualization 1, compared to the Evergreen Top 1000, the songs in the Top 2000 are quiet equally divided over the years. Songs from the 1970’s and 1980’s, though, seem to be a little bit more popular. In the graph of the Evergreen Top 1000, on the other hand, there is a big peak around the year 1970 and only a few songs were published in recent years. This difference in ages of the songs could be explained by the different focuses of the charts and also by the higher average age of the listeners of the NPO Radio 5 Evergreen Top 1000. In 2021, the average age of the NPO Radio 5 listeners was 66.8 years old. That same year, the average age of NPO Radio 2 - the radio station that broadcasts the Top 2000 - was 51.2 years old. These numbers come from an analysis done by RadioWereld.NL (RadioWereld.NL, 2022). That the Evergreen Top 1000 contains less songs from recent years, could be caused by the older listeners who are probably more likely to vote on songs from their youth.
Visualization 1: A grouped histogram showing the number of songs per year of publication for each chart.
Comparing danceability, energy, speechiness, acousticness & instrumentalness
Visualizations 2 and 3 show some audio features of songs per rank in the Top 2000 (2023) and the Evergreen Top 1000 (2023) respectively. The plotted audio features are the following, note that the descriptions are based on information from the website Spotify for Developers:
danceability, describes how suitable a track is for dancing based on a combination of musical elements including tempo, rhythm stability, beat strength, and overall regularity;
energy, represents a perceptual measure of intensity and activity. Typically, energetic tracks feel fast, loud; and noisy.
speechiness, detects the presence of spoken words in a track;
acousticness, predicts whether the track is acoustic;
instrumentalness, predicts whether a track contains no vocals. “Ooh” and “aah” sounds are treated as instrumental in this context.
As can be seen by comparing the two visualizations, there is no clear difference between the audio features of songs in the Top 2000 and in the Evergreen Top 1000. In addition there seems to be no correlation between the rank of the song and the value of audio features. Especially for acousticness and energy, the dots are scattered all over the dot plots. For danceability, instrumentalness and speechiness, there seems to be some trend, namely: moderate danceability, low instrumentalness and moderate speechiness. In the visualizations it’s not possible, though, to see any relationship between the ranks of songs and these features.
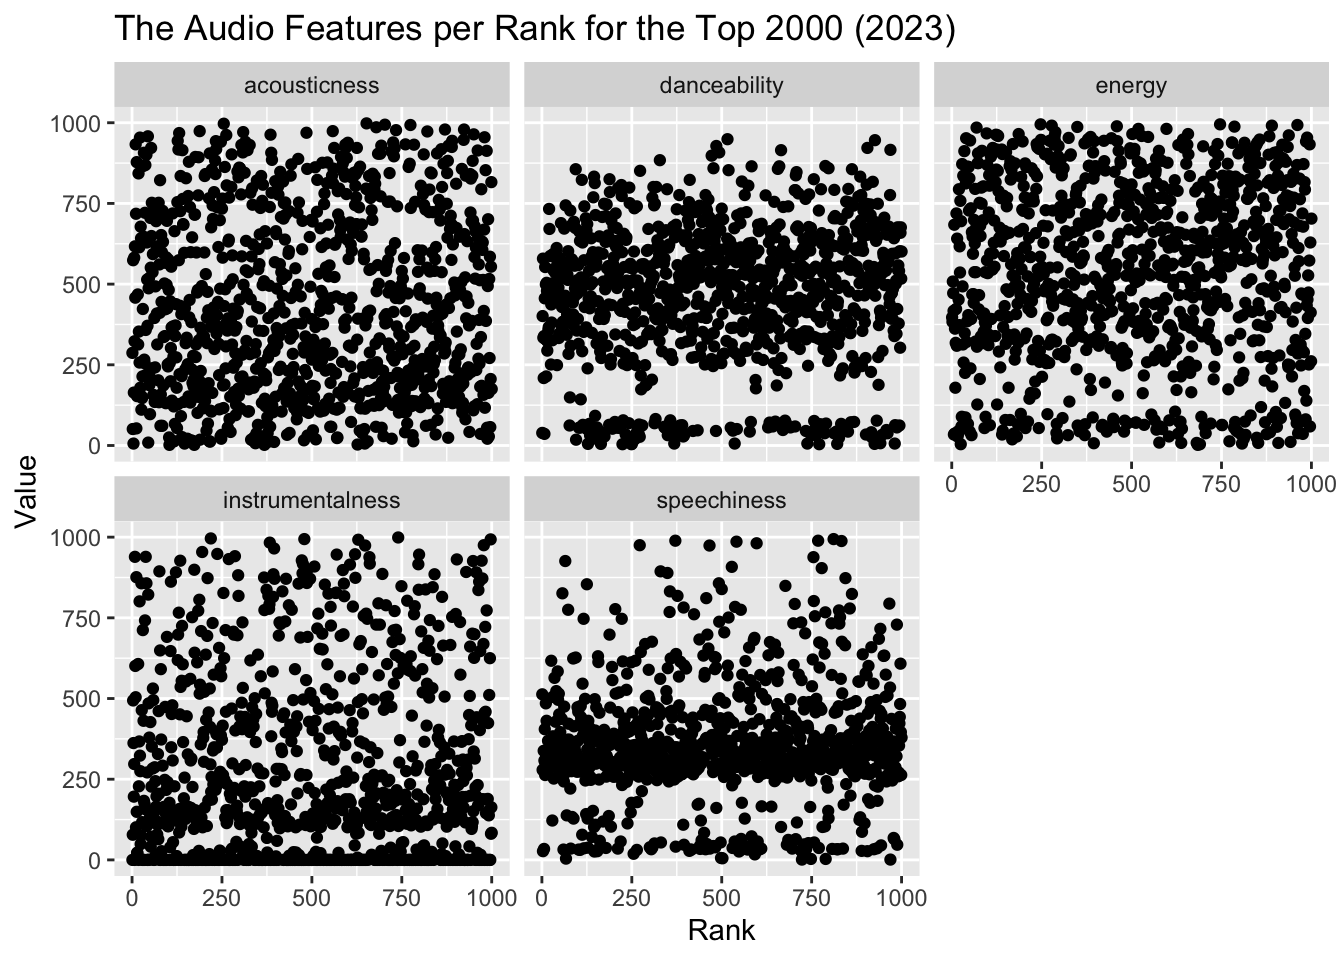
Visualization 2: Dot plots showing the audio features per rank for the Top 2000 from the year 2023.
Warning: Removed 45 rows containing missing values or values outside the scale range
(`geom_point()`).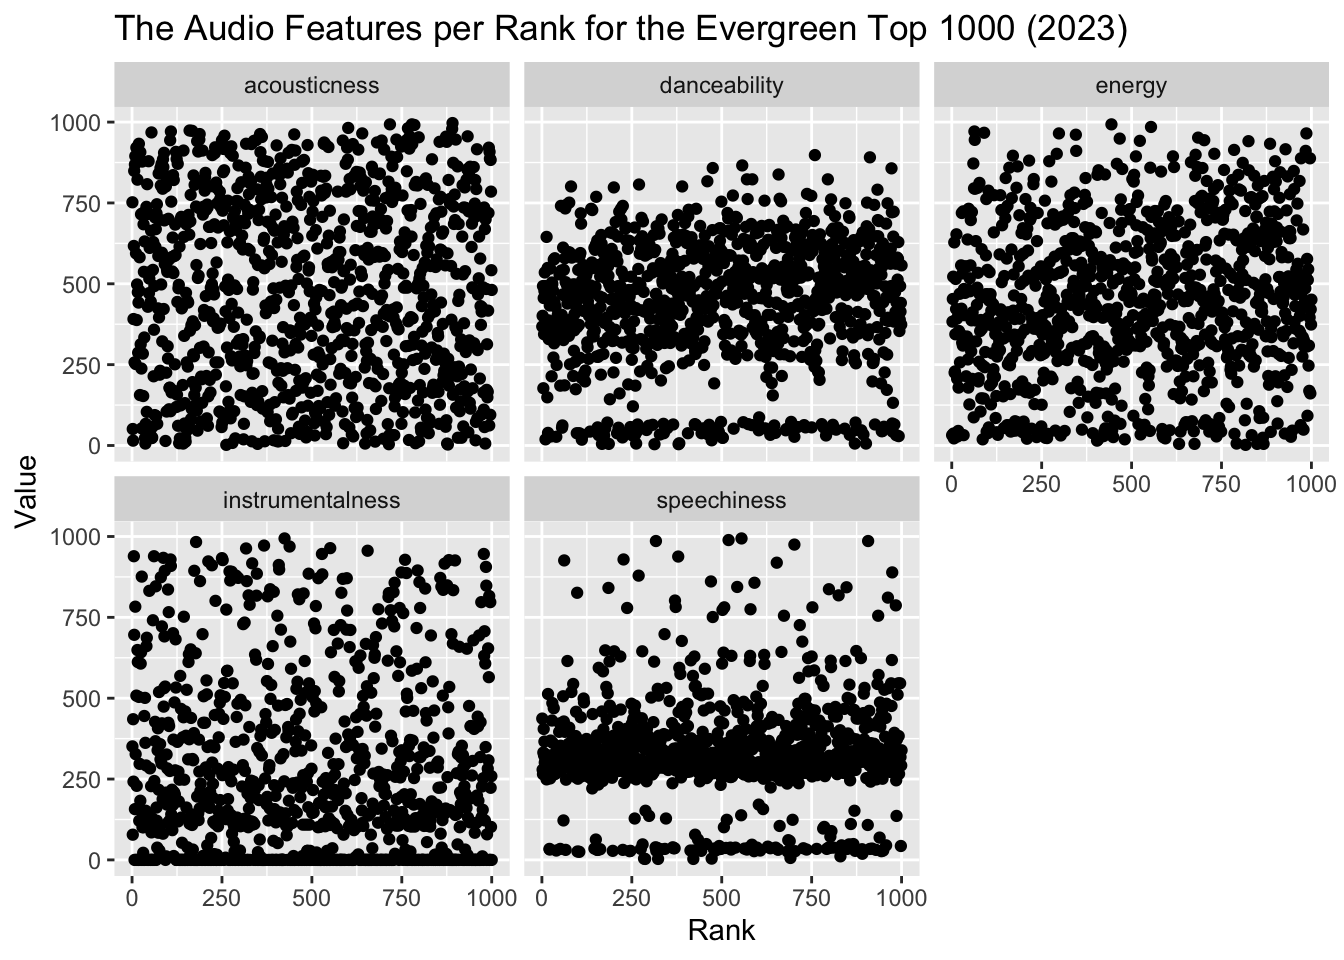
Visualization 3: Dot plots showing the audio features per rank for the Evergreen Top 1000 from the year 2023.
Comparing changes in ranking
Visualizations 4-7 show for each chart the biggest changes in ranking between the years 2022 and 2023. As can be seen, for both (the selection of) the Top 2000 and the Evergreen Top 1000, the changes upwards are bigger than the changes downwards. It should be said that some songs have disappeared from the charts. Those are not in the lolipop charts. The other way around, though, is also true, new songs have appeared. Those are also not in the charts. A difference between The Top 2000 and the Evergreen Top 1000 is that in the latter the biggest changes upwards are nearer to the thousandth place. This could be caused by the number of voters. When there are a lot of votes, the ranks are likely to be stable. When there are few votes, the ranks are likely to change. When there are more voters, there are more votes for the less popular songs. So, these lower ranks will probably as a result be more stable. There are no statistics about the concrete numbers of voters for the Top 2000 and the Evergreen Top 1000. The last couple of years, the NPO has kept it a secret (Vos, 2021). It is known, though, that NPO Radio 2 has a lot more listeners than NPO Radio 5. You can find statistics about this on the website of Nationaal Medio Onderzoek. Therefore, it would be logical that there are more voters for the Top 2000 and that the changes in ranking are more equally divided over this chart.
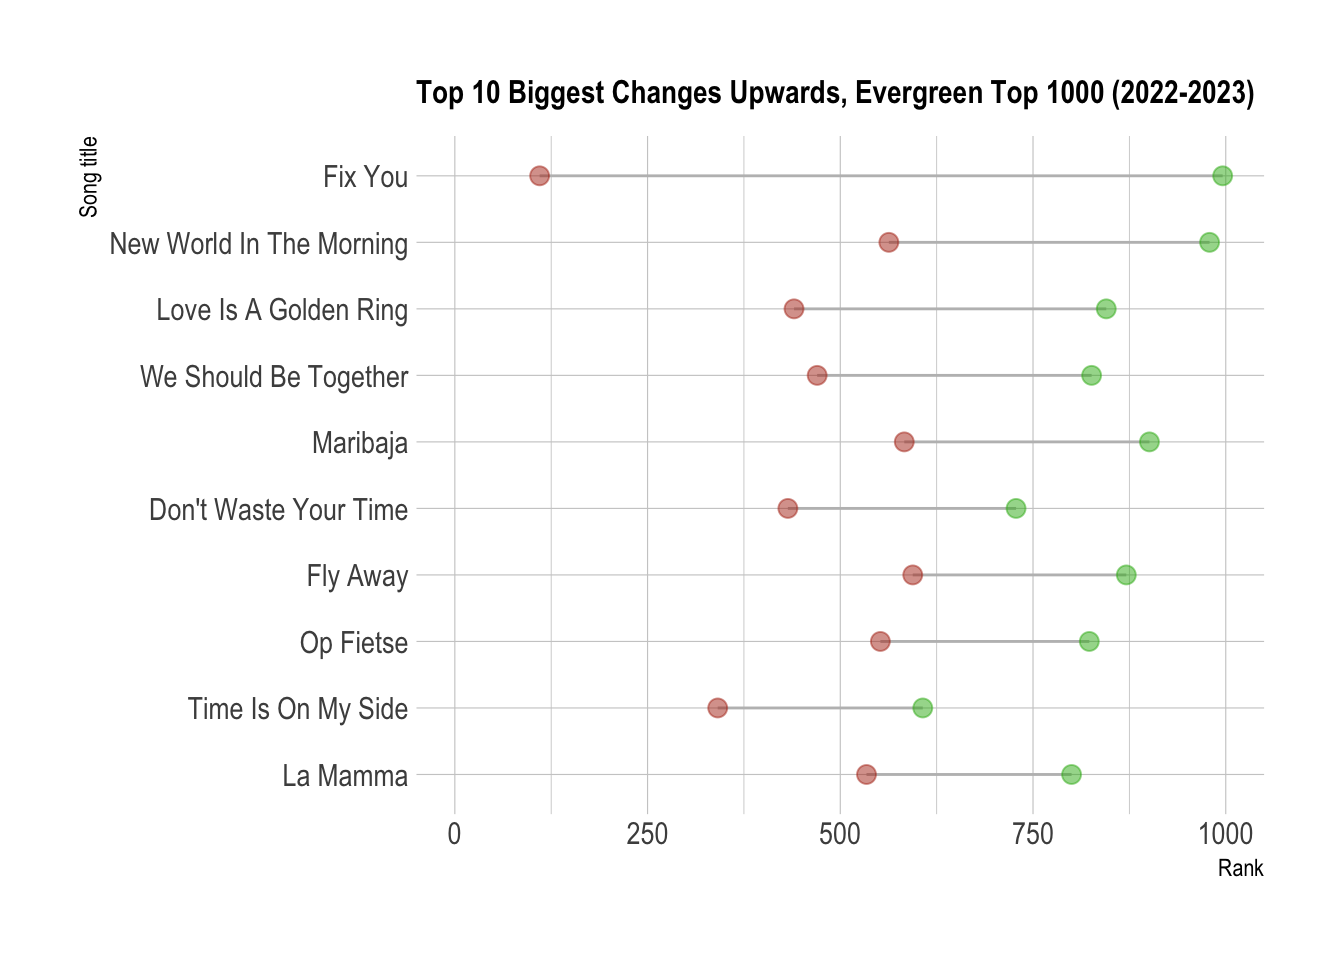
Visualization 4: Lolipop chart showing the top 10 biggest changes upwards in the Evergreen Top 1000 chart from the year 2023 compared to 2022.
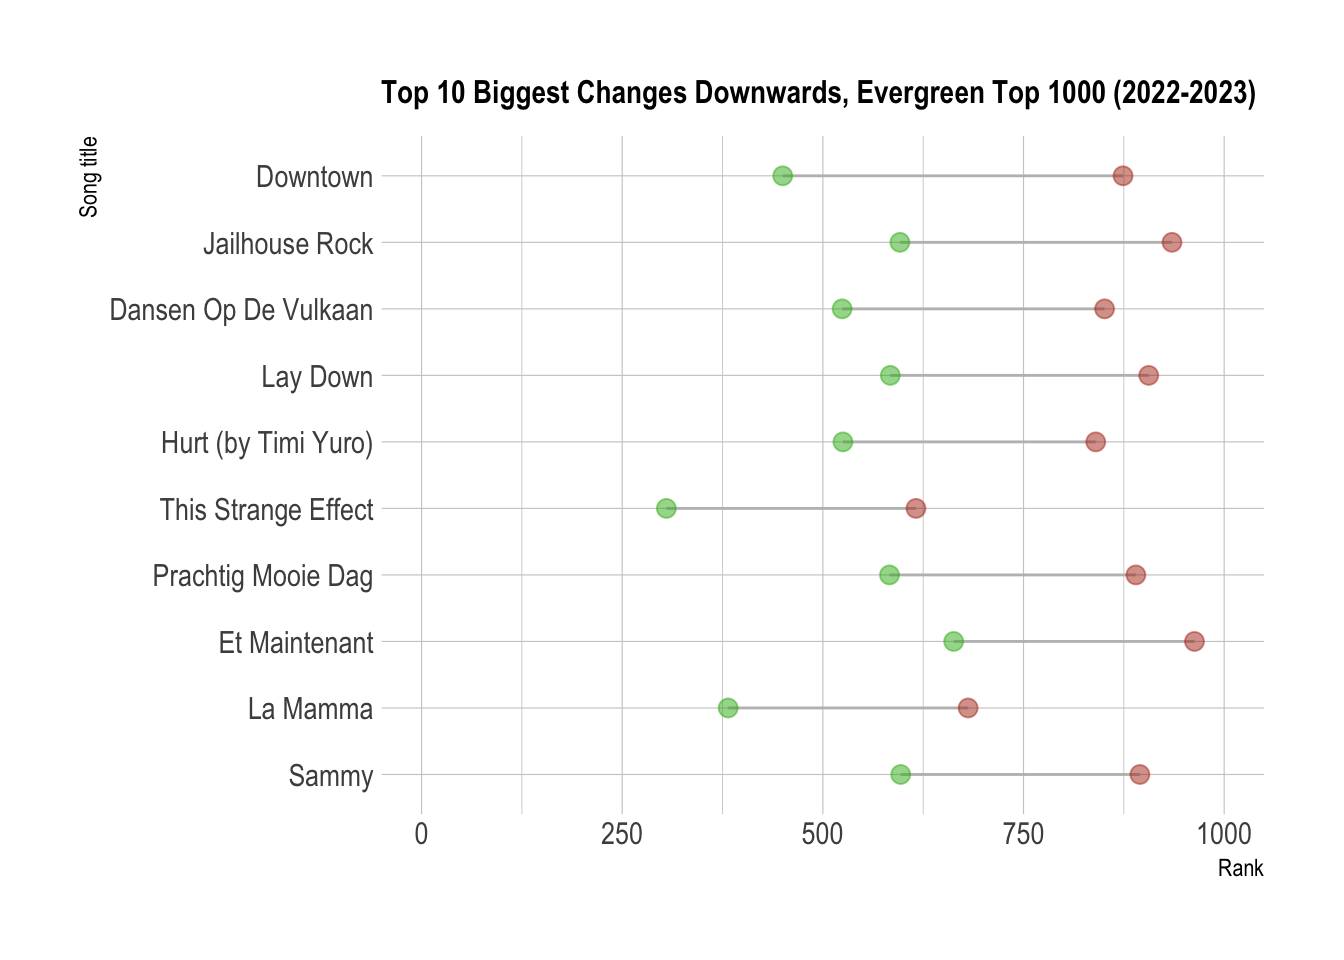
Visualization 5: Lolipop chart showing the top 10 biggest changes downwards in the Evergreen Top 1000 chart from the year 2023 compared to 2022.
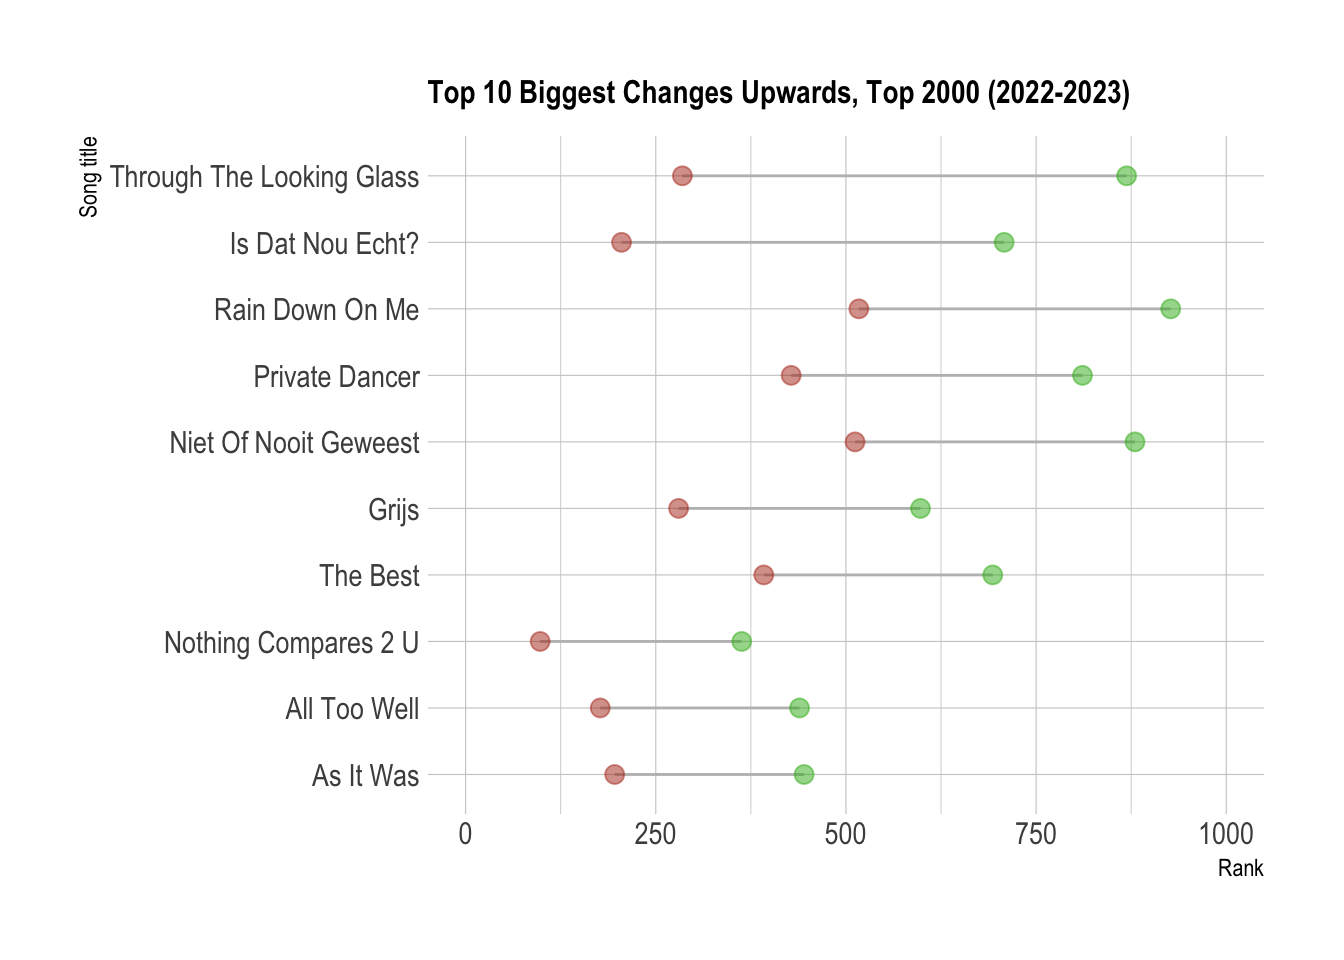
Visualization 6: Lolipop chart showing the top 10 biggest changes upwards in the Top 2000 chart from the year 2023 compared to 2022.
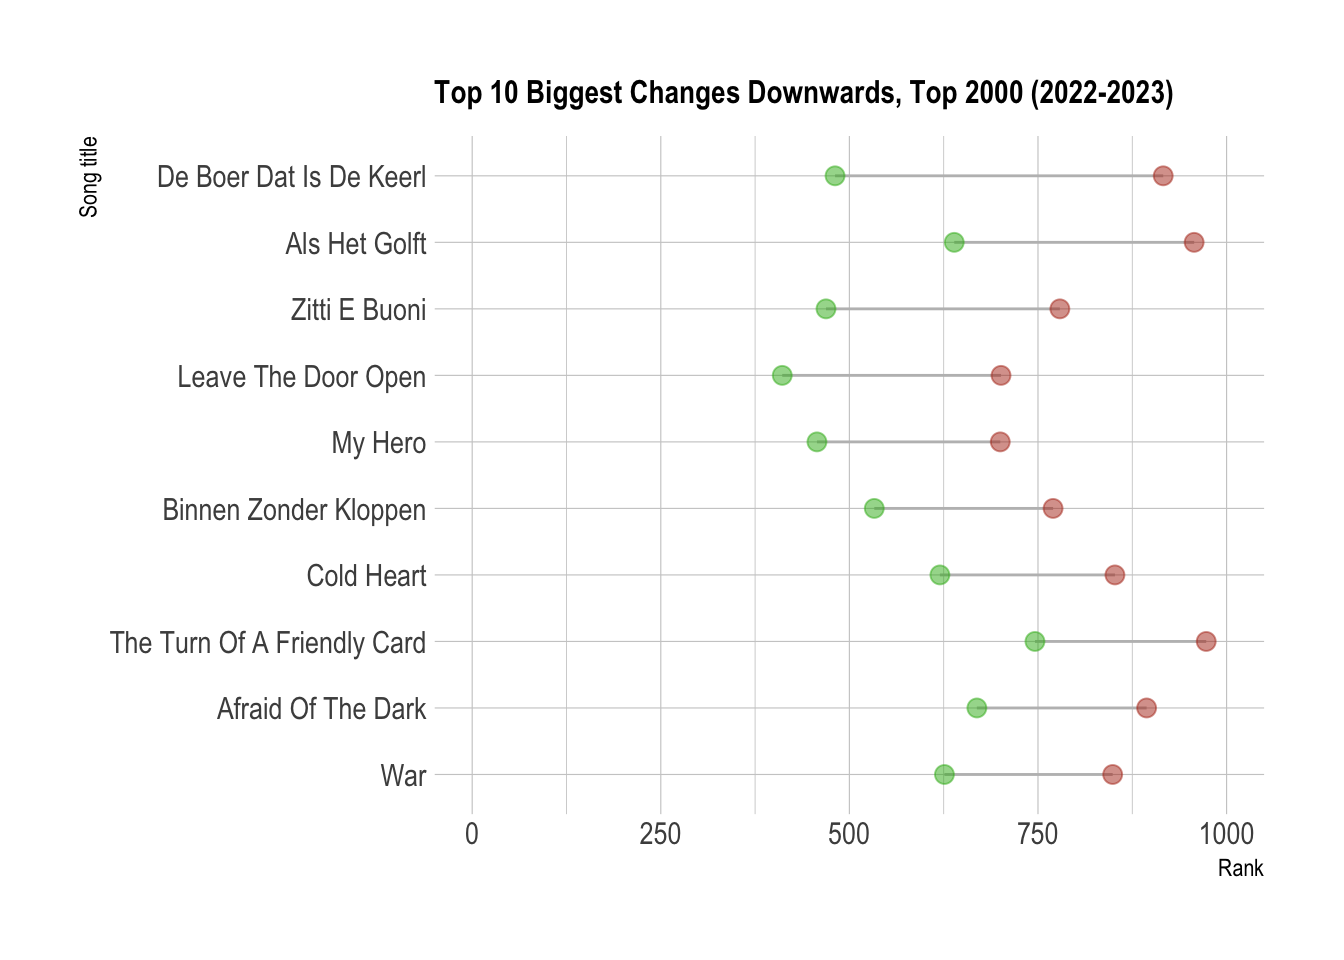
Visualization 7: Lolipop chart showing the top 10 biggest changes downwards in the Top 2000 chart from the year 2023 compared to 2022.
4. Discussion
In conclusion, the NPO Radio 2 Top 2000 and the Evergreen Top 1000 are quiet different in content. In the Top 2000, all the years beginning from approximately 1965 are almost equally represented. In the Evergreen Top 1000, the 1960’s and 70’s are clearly best represented. This difference could be caused by the different focuses of the charts and by the different ages of the voters. Another difference is that the changes in ranking of the first half of the Top 2000 seem to be more equally distributed over the chart than the changes in ranking of the Evergreen Top 1000, or at least in case of the upward changes. This could be caused by a difference in number of voters. The project also included an analysis of some audio features. It’s hard, however, to draw any conclusions on the danceability, energy, speechiness, acousticness and instrumentalness of the songs in these charts. The dots on the plots were too much scattered around. These were two charts, that have been analyzed for this project. For later research, it would be interesting to compare other charts as well. There are a lot of Dutch music charts, also regional ones. It would be nice to compare data of the songs with data of the voters. That way it would be possible to research which music is popular by which public.
5. Bibliography
NOS Nieuws. (2023, December 28). De radioluisteraar smult van Top Zoveels en andere actieweken. Retrieved January 14, 2024, from https://nos.nl/artikel/2503062-de-radioluisteraar-smult-van-top-zoveels-en-andere-actieweken
Prinz, A. (2017). Rankings as coordination games: the Dutch Top 2000 pop song ranking. Journal of Cultural Economics, 41(4), 379-401.
RadioWereld.NL. (2022, January 26). Radioluisteraar was in 2021 gemiddeld 51,3 jaar oud. Retrieved January 14, 2024, from https://radiowereld.nl/medianieuws/2022/01/radioluisteraar-was-in-2021-gemiddeld-513-jaar-oud/#:~:text=De%20gemiddelde%20leeftijd%20van%20de%20Radio%2010%20luisteraar%20lag%20in,2%20(51%2C2).
Vos, M. (2021, December 19). Geheimzinnigheid rond Top 2000: waarom de NPO amper cijfers prijsgeeft. Nu.nl. Retrieved January 14, 2024, from https://www.nu.nl/media/6173332/geheimzinnigheid-rond-top-2000-waarom-de-npo-amper-cijfers-prijsgeeft.html
